|
Comprehensively Answers
How green is my city? |
|
|
Higher Scores Are Greener Cities
Large Cities
Green Temp 2021 Score* Change* Population City 190 ▲ 0.8° 662,248 Vancouver 179 ▲ 0.6° 2,794,356 Toronto 174 ▲ 0.8° 565,322 Surrey 163 ▲ 0.8° 656,480 Brampton 159 ▼-0.9° 1,010,899 Edmonton 154 ▼-1.0° 749,607 Winnipeg 152 ▲ 0.6° 717,961 Mississauga 151 ▼-0.3° 569,353 Hamilton 144 ▼-0.6° 1,017,449 Ottawa 132 ▲ 0.4° 1,762,949 Montréal 125 ▼-0.6° 549,459 Québec City 123 ▼-0.3° 1,306,784 Calgary Medium Cities
Green Temp 2021 Score* Change* Population City 180 ▼-0.3° 186,948 Burlington 180 ▲ 0.8° 249,125 Burnaby 174 ▼-0.3° 256,885 Kitchener 169 ▲ 0.3° 229,660 Windsor 168 ▲ 0.8° 209,937 Richmond 166 ▲ 0.4° 422,324 London 166 ▲ 0.6° 213,759 Oakville 165 ▲ 0.6° 202,022 Richmond Hill 163 ▲ 0.6° 175,383 Oshawa 159 ▲ 0.6° 338,503 Markham 156 ▲ 0.6° 323,103 Vaughan 148 ▲ 0.9° 439,819 Halifax 144 ▼-0.6° 291,041 Gatineau 139 ▼-0.6° 166,004 Greater Sudbury 137 ▲ 0.3° 266,141 Saskatoon 136 ▼-0.2° 226,404 Regina 121 ▲ 1.6° 172,950 Sherbrooke 120 ▲ 0.4° 254,438 Longueil 113 ▲ 0.4° 438,366 Laval Small Cities
Green Temp 2021 Score* Change* Population City 180 ▲ 0.5° 91,867 Victoria 169 ▼-0.3° 121,436 Waterloo 163 ▼-0.3° 104,688 Brantford 163 ▼-0.3° 143,740 Guelph 163 ▼-0.6° 83,651 Peterborough 158 ▲ 0.8° 148,625 Coquitlam 157 ▼ 0.0° 144,576 Kelowna 153 ▼-0.4° 136,803 St. Catharines 145 ▲ 0.6° 153,524 Abbotsford 143 ▼-0.3° 138,479 Cambridge 138 ▼ 0.0° 147,829 Barrie 137 ▼-0.1° 132,485 Kingston 130 ▲ 0.5° 108,843 Thunder Bay 129 ▼-0.1° 110,525 St. John's 128 ▲ 0.3° 79,470 Moncton 128 ▼-0.3° 144,723 Saguenay 117 ▲ 0.9° 69,895 Saint John 107 ▼-0.6° 149,683 Lévis 103 ▼-0.6° 139,163 Trois-Rivières |
Canada's World Impact
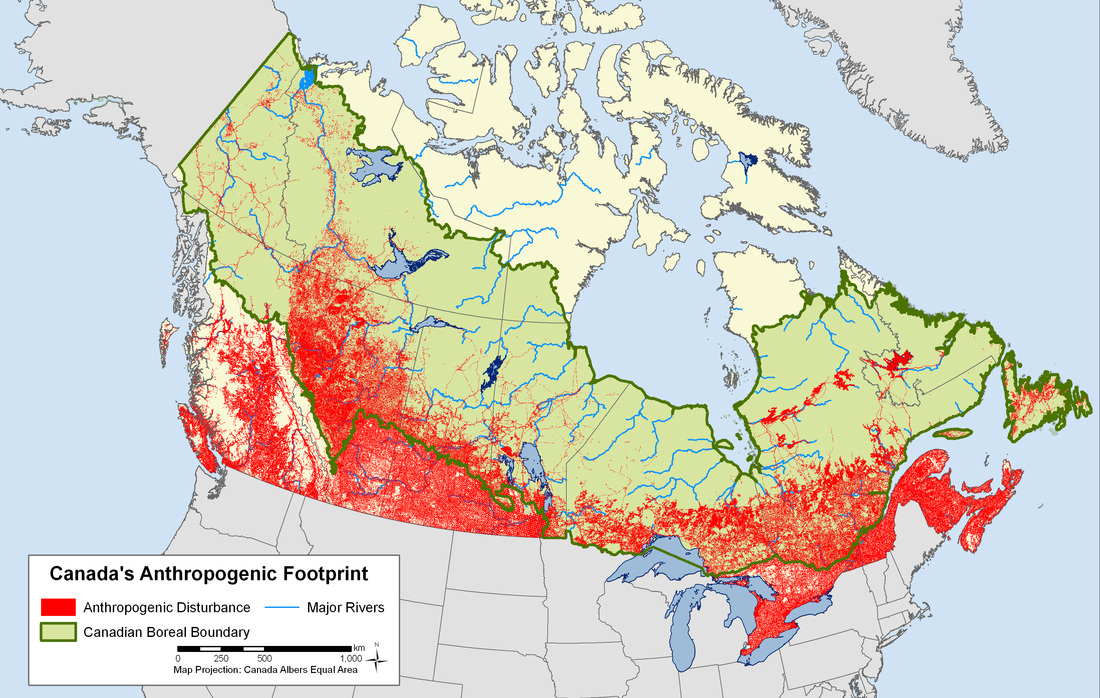
Place Description
1 Longest Coastline 2 Country Size area 1 Footprint Size per person, worst in G20 39 Population Size A Broad Base of Indicators
Index National Coverage
2021 Cities Score
Population Scored Coverage Province 14,223,942 24 66.1% Ontario 8,501,833 9 45.9% Quebec 5,000,879 8 44.6% British Columbia 4,262,635 2 54.4% Alberta 1,342,153 1 55.9% Manitoba 1,132,505 2 43.5% Saskatchewan 969,383 1 45.4% Nova Scotia 775,610 2 19.3% New Brunswick 510,550 1 21.6% Newfoundland & Labrador 36,991,981 50 53.9% CANADA Source Statistics Canada This edition could not have been completed without the participation, engagement, comments or criticisms from the following
Environment and Climate Change Canada
Federation of Canadian Municipalities Regional District of Metro Vancouver Government of Ontario - RPRA Actuaries Climate Index The City of Burlington The City of Montreal The City of London Statistics Canada |
Column Explanations
Score* - City anthropogenic footprint scores. Higher is better
Change* - 2019 average temperature rise above historic norm. ▼colder,▼same,▲below 1.5°c, ▲Above 1.5°c, ▲above 2°c from Accuweather db
Score* - City anthropogenic footprint scores. Higher is better
Change* - 2019 average temperature rise above historic norm. ▼colder,▼same,▲below 1.5°c, ▲Above 1.5°c, ▲above 2°c from Accuweather db